You raise a PR, the pipeline kicks off - and it goes red.
Now what?
Most developers do one of two things: they ping the Platform Engineering team immediately, or they open ten tabs and start randomly poking at things.
Neither is a great strategy!
There's a better way to think about it: the onion formula. When something breaks in your Route-to-Live (RTL) pipeline, start from the outside and peel inward. Each layer has a clear set of things to check. You don't move to the next layer until you've ruled out the current one.
Route-to-Live is the full journey your code takes from merge to production; through CI/CD pipelines, build stages, deployment targets, and live environments. A lot can go wrong along the way. The onion formula gives you a systematic way to find it.
The Layers at a Glance

| Layer | Name | First thing to check |
|---|---|---|
| 0 | Application | Does it run locally? |
| 1 | Container | Does docker run work? |
| 2 | Pipeline + Artifact | Which step went red? |
| 3 | Deployment | Is the image pulled correctly? |
| 4 | Running Service | What do the pod logs say? |
| 5 | Environment & Config | Is it just your service? |
| 6 | Data & Traffic | Is the behaviour wrong or the infra? |
Layer 0 — Application Level
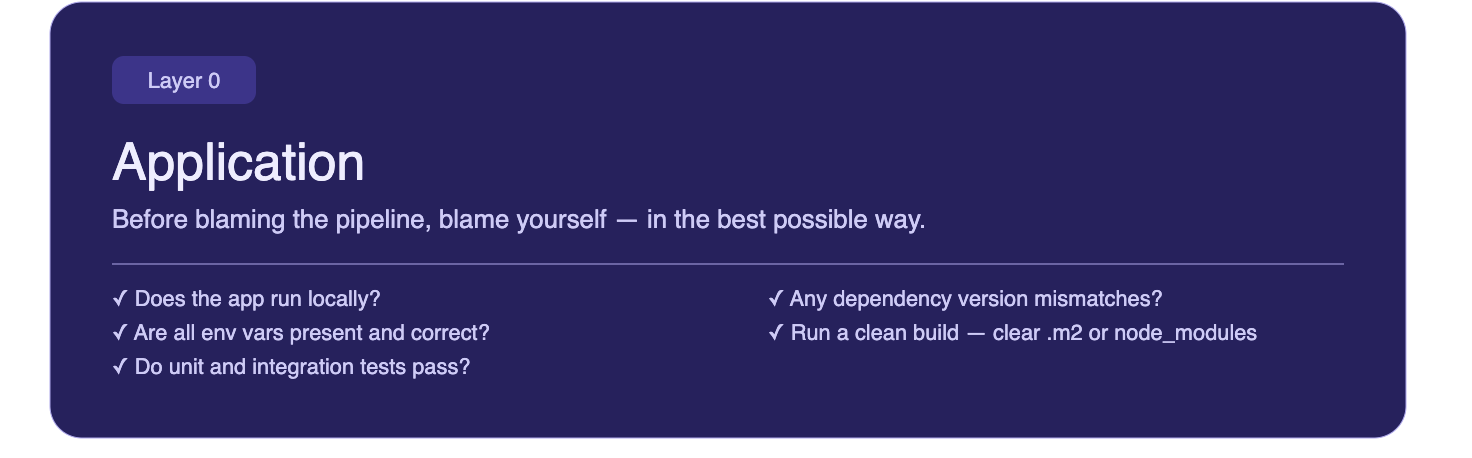
Before blaming the pipeline, blame yourself. In the best possible way!
Is the application logic actually correct? Are there missing environment variables that your code expects? Unresolved dependency conflicts? A configuration value that works on your machine but was never committed?
This is the layer that's entirely yours: no infra, no platform team, no pipeline. Just your code and its direct dependencies.
Check:
- Does the app start and behave correctly outside of any container?
- Are all required environment variables present and set to sensible values?
- Do your unit and integration tests pass locally?
- Any dependency version mismatches or missing packages?
- Run a clean build: delete your local dependency cache and rebuild from scratch. For Java projects, clear
.m2; for Node, deletenode_modules. Stale or corrupt local caches are a surprisingly common source of "works on my machine" failures that only show up properly when you force a clean state.
If you find the issue here, you've saved everyone a lot of time!
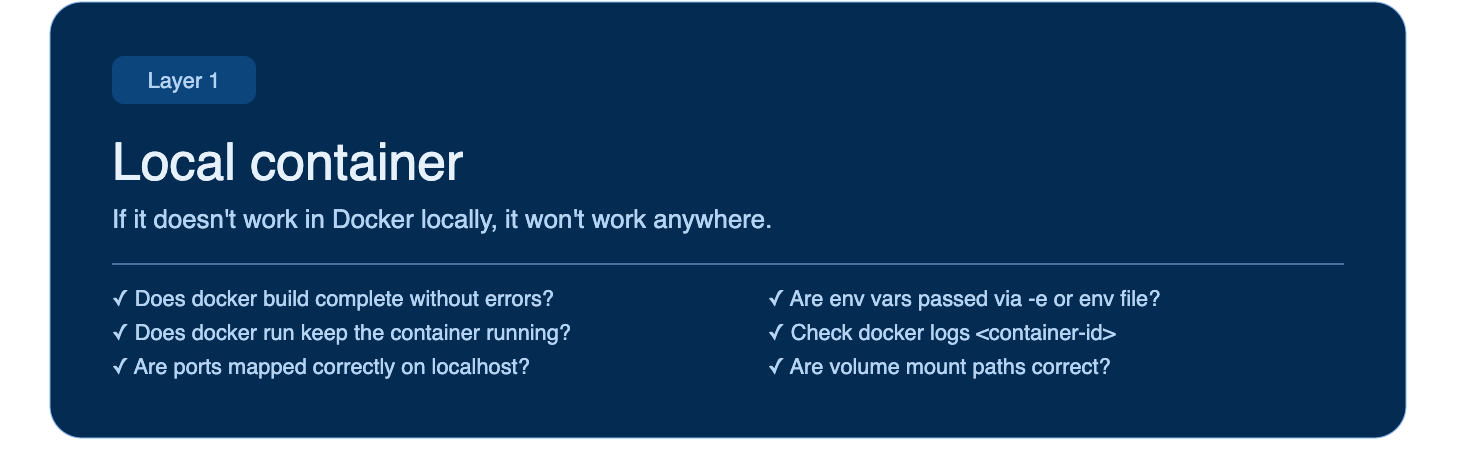
Layer 1 — Local Container Run
Your app works. Now put it in a box.
Before your code ever touches a pipeline, you can catch a large class of issues by running it in a container locally. A Dockerfile that builds on your machine is not guaranteed to behave the same way in CI — but it's a much better starting point than pushing and hoping.
Check:
- Does
docker buildcomplete without errors? - Does
docker runstart the container and keep it running? - Are ports mapped correctly? Can you actually reach the app on localhost?
- Are environment variables passed in correctly via
-eor an env file? - If you're using volume mounts, are the paths correct?
- Are all dependencies working as expected in an isolated environment?
- Is the application behaving as expected end-to-end?
Check container logs with docker logs <container-id> - the output will usually tell you exactly what the app couldn't find or couldn't start.
If the container fails locally, it will fail in the pipeline. Fix it here first!
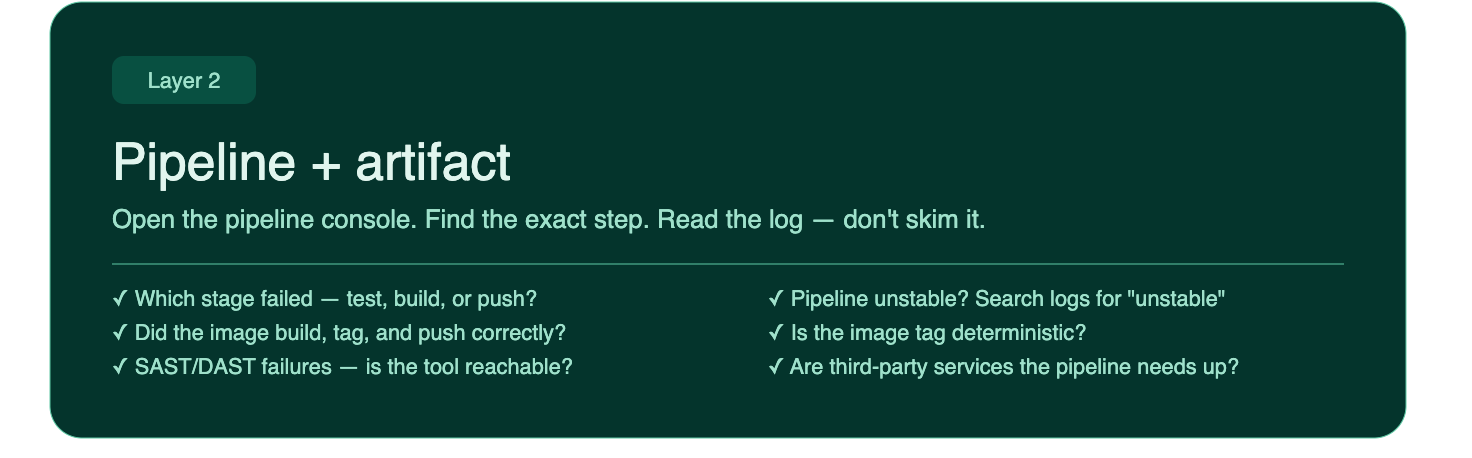
Layer 2 — The Pipeline + Artifact
The container works locally. Now the pipeline is failing. Time to read!
Open the pipeline console - not the summary, the actual console output of the failed stage! Most CI tools (GitHub Actions, GitLab CI, Jenkins, Harness) show you a step-by-step breakdown. Find the exact step that went red and read the log lines around it. If stages have interdependencies, check the surrounding steps too.
Before diving into what failed, take a moment to understand what each stage actually does. If you have access to the pipeline script, even better, you can replicate individual steps locally and see exactly what's happening without waiting for a full pipeline run.
Common failure points:
- A test that passes locally but fails in CI: environment difference, missing secret, timing issue, transitive dependency clash, or a quarantined dependency flagged for vulnerabilities
- A build step that can't find a dependency
- An image that built successfully but failed to push to the registry
- SAST/DAST scan failures, check them directly: is the scanning tool's registry reachable? What HTTP status code is it returning? Can you access it directly?
Check:
- Which stage failed: test, build, push, or something else?
- What does the exact error message say? Don't skim it.
- Did the image get built and tagged correctly? Where is the pipeline extracting the tag from? Is that value correct?
- Did the image land in the registry with the tag you expect? Check the registry directly.
- Is the image tag deterministic, or could there be a naming collision?
- Are any third-party services the pipeline depends on down?
- If you have access, check deployments directly or look at any monitoring or uptime checks available.
The pipeline console is your primary source of truth at this layer. Resist the urge to re-run the pipeline hoping it self-heals until you understand why it failed. That said, sometimes a transient failure is just a transient failure! If you genuinely can't explain it, one more re-run is reasonable. I've had pipelines fail mysteriously and resolve themselves on the second attempt.
One more thing: if your pipeline result shows as unstable rather than failed, don't ignore it. Unstable usually means something completed but with warnings or partial failures: test flakiness, coverage thresholds not met, or a flagged scan result that didn't hard-fail. Search the console output for the word "unstable" and read the surrounding lines. The build will often tell you exactly which step flagged it, and that's your starting point.
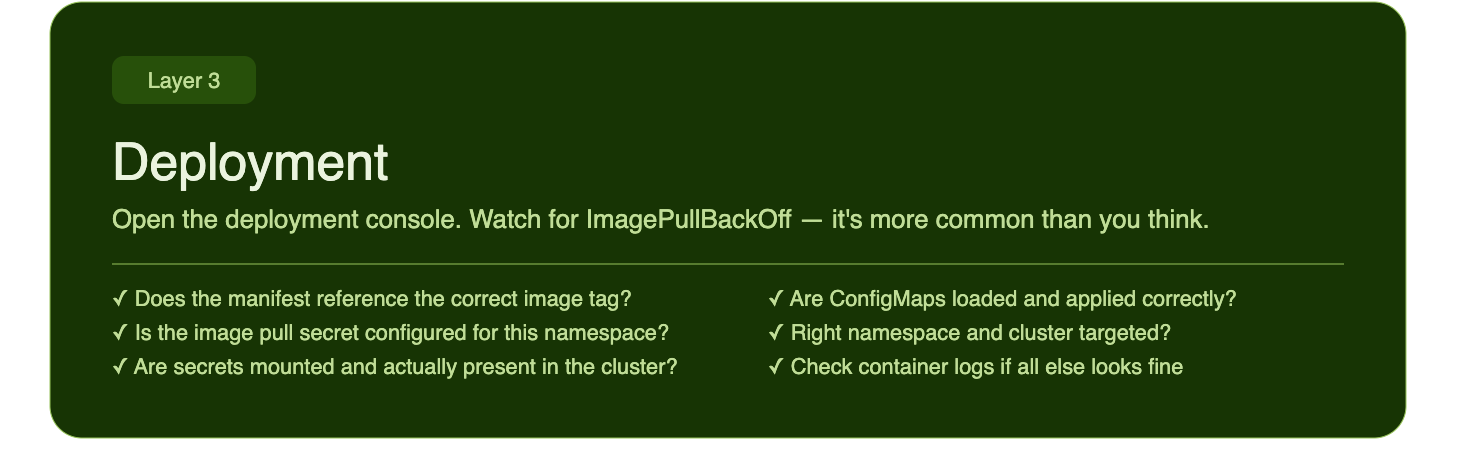
Layer 3 — The Deployment
The image is in the registry. Now it needs to land somewhere.
Open the deployment console - whether that's ArgoCD, Flux, a Helm release, a Kubernetes dashboard, or your cloud provider's deployment UI. Look at the rollout status and events. Kubernetes events in particular are very chatty and very useful.
The most common error at this layer for application developers: ImagePullBackOff.
This usually means one of a few things:
- The image tag in your deployment manifest doesn't match what's in the registry
- The registry is private and the cluster doesn't have the right pull secret configured
- The image name has a typo
- The image simply wasn't pushed successfully, go back to Layer 2
Beyond image issues, check the config!
Check:
- Does the deployment reference the correct image and tag?
- Is the image pull secret configured for this namespace?
- Are environment variables set correctly in the deployment manifest?
- Are secrets mounted and populated, not just referenced but actually present in the cluster?
- Have the correct ConfigMaps been loaded and applied?
- Is the deployment targeting the right namespace and cluster?
A misconfigured environment variable at this layer is one of the most common sources of "it works in staging but not in prod" bugs. Check the actual values, not just whether the keys exist. And if the above checks don't surface anything obvious, pull the container logs, they'll usually tell you something useful even at this stage.
Layer 4 — The Running Service
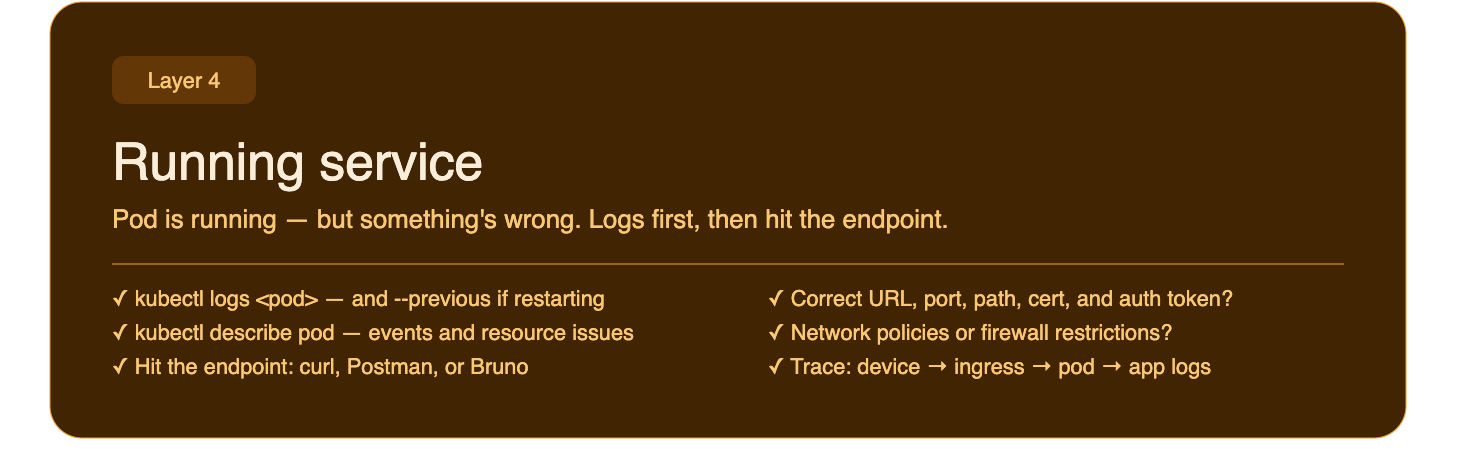
The deployment succeeded. The pod is running. But something is still wrong!!
Pull the pod and container logs first, not the deployment logs, the container logs. This is where you'll see what the application itself is saying on startup: stack traces, failed connections, missing config, panics.
kubectl logs <pod-name> -n <namespace>
kubectl logs <pod-name> -n <namespace> --previous  # if the container restarted
kubectl describe pod <pod-name> -n <namespace>     # events + resource issues
If the pod is crash-looping, --previous is your friend.
Once the pod is stable, try hitting the service directly.
Check connectivity:
- Use
curl, Postman, or Bruno to make a request to the service endpoint - Is the URL correct: hostname, port, path?
- Does the environment require a certificate? Is it trusted?
- Do you need an auth token or API key to reach this service?
- Are there network policies or firewall rules restricting access in this environment?
- Is there an ingress or load balancer in front of the service? Is that configured correctly?
Trace the full request path: your device → ingress/nginx → pod → app logs. See where it drops off. If the control to fix some of these is beyond your access, this is the right moment to bring in your platform engineer. You'll come to them with a specific, well-scoped question rather than a vague "it's broken".
This layer is where "it deployed but it doesn't work" problems live.
Logs first, then connectivity.
Layer 5 — The Environment & Config
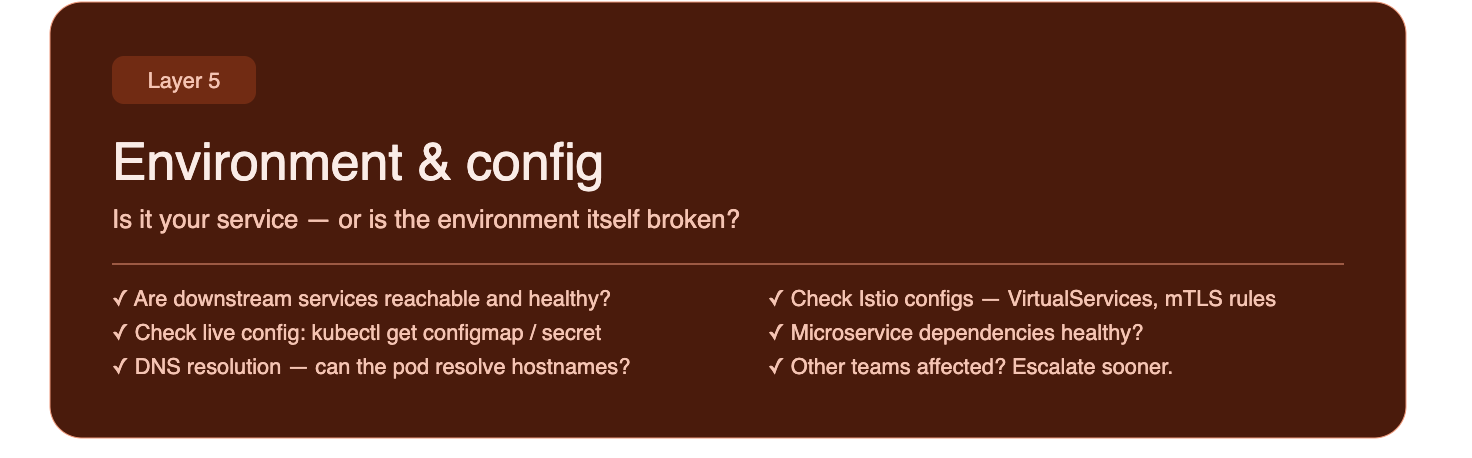
Your service looks healthy. But something upstream might not be.
This layer is about ruling out whether the problem is yours or the environment's. Is a dependency down? Is shared infrastructure misbehaving? Do you have the correct credentials and secrets configured to connect to downstream services? Have you whitelisted the necessary hosts for connectivity?
Check:
- Are downstream services (databases, message queues, third-party APIs) reachable and healthy?
- Check DNS resolution. Can your pod resolve the hostnames it needs to?
- Check the actual config values live in the cluster, not just what you think you deployed?
- Are feature flags affecting behaviour in this environment?
- Is networking between services correct: service names, ports, protocols?
- Are all intermediary services running correctly: nginx, proxies, internal gateways?
- If you're running a service mesh, check your Istio config: VirtualServices, DestinationRules, and mTLS policies can all silently affect traffic in ways that don't show up in your app logs. If you're in a microservices architecture, check the health and config of the specific downstream services your app depends on, not just the shared infrastructure.
- Is this affecting only your service, or are other teams seeing issues too?
That last question matters. If other teams are affected, the problem is probably not yours to fix alone. Escalate sooner rather than spending hours on something outside your blast radius.
Layer 6 — Data & Traffic
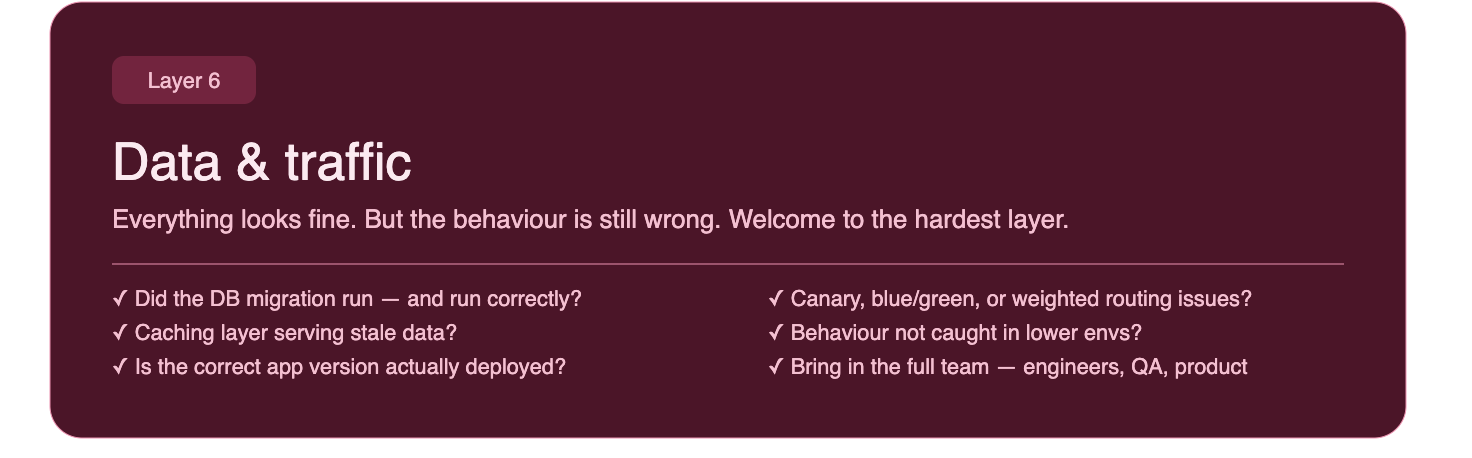
Everything looks fine. Pods are healthy, logs are clean, you can hit the endpoint. But the behaviour is still wrong.
Welcome to the hardest layer.
Check:
- Did a database migration run, and did it run correctly?
- Is there a caching layer serving stale data?
- Is traffic being routed correctly? Are there canary deployments, blue/green switches, or weighted routing rules that might be sending traffic somewhere unexpected?
- Are feature flags toggled correctly for this environment?
- If you're doing a rollout, are some users hitting the old version and some the new?
- Is the correct version of the app actually deployed? Verify the running version matches what you expect. It's easy to assume a deployment succeeded when it silently rolled back.
- Is this a behaviour that simply wasn't caught in a lower environment? Some bugs only surface under production like load, data volume, or user patterns. If it looks like genuinely new behaviour that passed all your RTL gates, that's important signal, it means your lower environments may not be representative enough.
This layer is rarely a solo debug. Pull together a small group: engineers, Quality Engineers, product, and whoever owns the data or traffic layer. You'll need different perspectives, and decisions made here can have real user impact. Come with your evidence from the layers above, not just a hunch.
The Formula in Practice
When something breaks in your RTL pipeline, resist the instinct to jump straight to the most dramatic possible explanation.
Start at Layer 0. Rule it out.
Move to Layer 1. Rule it out.
Keep peeling!
Most issues in a Route-to-Live environment are found in Layers 1–4. A container that won't build, a pipeline step that fails, an image that can't be pulled, a pod that crashes on startup. These are tractable. They have clear signals. The logs will tell you.
The deeper layers: environment config, data, traffic, are where things get genuinely subtle. But you'll only end up there if you've already ruled out everything above, which means you'll arrive with real context rather than guesses.
Know what your pipeline does. Know what it expects. Start there.
And when you're stuck: logs first, then your code assistant or LLM, and then a platform colleague.
Debugging is a skill.
The onion formula is a habit.
Build the habit!